Thursday, February 24, 2011

Brainstormig

BRAINSTORMING

Title: Tsunami

Introduction

· Talk about what you will talk about

· Talk about what a tsunami is.

3 main points/ Body

· Characteristics

· Warnings and Predictions

· How tsunami is made

· Measurments

· List of common tsunamis

Conclusion

· Opinion

· Preventing Tsunamis

· Jeopardised areas

· Concluding sentence

Tsunami report

Tsunamis

http://www.todotube.es/imagenes/tsunami.jpg

Introduction:

Do you know what causes the deaths of about 200,000 people per year! It is a natural hazard called a tsunami! A tsunami is a series of waves, usually created in an ocean or another body of water by an earthquake, landslide, volcanic eruption, or meteorite impact. Tsunamis can also be formed when the surface under the water creates motions, that create earthquakes and all these things that are needed to create an Earthquake. Tsunamis can cause huge destruction and devastation when they hit coastlines. Tsunamis are huge and can travel very quickly, at about 700 km/hr, but they are 30 meters large once they “strike” (usually in open oceans, when the tsunami is beginning it is only 1 meter tall.) Did you know that when a tsunami is outstretched all the way it is 100 km across almost the length of 1000 American football fields! This is the disaster that I will talk about, but I won’t only talk about the usual things I will talk about interesting things, like characteristics of a tsunami, how a tsunami is measured in height strength and width, next I will explain the warnings and predictions, after that I will talk about places that are effected by tsunamis, when that is done I will talk about how tsunamis are created.

Characteristics:

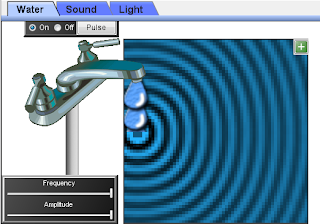
A tsunami in the deep ocean has a wavelength of about 200 km (120 mi). Such a wave travels at well over 800 km per hour (500 mph), but due to the enormous wavelength the wave oscillation at any given point takes 20 or 30 minutes to complete a cycle and has amplitude of only about 1 meter (3.3 ft). This makes tsunamis difficult to detect over deep water. Ships rarely notice their passage. When the tsunami's wave peak reaches the shore, the resulting temporary rise in sea level is termed 'run up'. Run up is measured in meters above a reference sea level. A large tsunami may feature multiple waves arriving over a period of hours, with significant time between the wave crests. The first wave to reach the shore may not have the highest run up. Tsunamis can travel at speeds of up to 400-500 miles per hour. In deep waters (oceans), tsunamis are low and wide, often less than three feet high. There is a difference of 95 miles between the crest of one wave and the next. In shallower waters, tsunamis usually become more deadly. A Tsunami can reach up to heights of 100 feet or more and crash inland. An interesting fact about tsunamis, tsunamis velocity depends on the depth of water through which it travels.

Tsunamis travel approximately 475 mph in 15,000 feet of water. In 100 feet of water the velocity drops to about 40 mph.

Measuring a Tsunami:

Intensity scales

The first scales that were recently used to measure the strength of tsunami were theSieberg-Ambraseys” scale, this is mostly used in the Mediterranean Sea and the Imamura-Iida intensity scale, and is used in the Pacific Ocean. The latter scale was modified by “Soloviev”, who calculated the Tsunami intensity according to this formula.

\,\mathit{I} = \frac{1}{2} + \log_{2} \mathit{H}_{av}

In this formula the Hav is the average wave height along the nearest coast. This scale, that is known as theSoloviev-Imamura” tsunami intensity/strength scale, this is used in the global tsunami catalogues compiled by theNGDC” and “NOAA” and the “Novosibirsk Tsunami Laboratory” as the main parameter basically for the size of the tsunami.

Magnitude scales

The first scale that calculated a magnitude for a tsunami, rather than the intensity at a particular location was the ML scale, this was proposed by “Murty & Loomis” based on the potential energy. There were difficulties in calculating the potential energy of the tsunami that is why this scale is rarely used. This “theory” was based on this formula.

\,\mathit{M}_{t} = {a} \log h + {b} \log R = \mathit{D}

In this formula the “h” is the maximum tsunami-wave amplitude (in meters) it is measured by a tide at a distanceR” from the epicenter,a”,b” and d” are constants used to make the Mt scale match as closely as possible with the moment magnitude scale.

Warnings and Predictions:

Drawbacks can serve as a brief warning. People who listen to drawback, can survive only if they immediately run for high ground or seek the upper floors of high buildings. In 2004, a 10 year old girl named Tilly Smith was on Maikhao beach (in Phuket), Thailand with her parents and sister, and having learned about tsunamis recently in school, she told her family that a tsunami might be about to happen. Her parents warned others minutes before the wave arrived, saving a lot of lives. A tsunami cannot be precisely predicted, even if the magnitude and location of an earthquake is known. Geologists, oceanographers (study ocean), and seismologists analyze almost every earthquake, and based on many factors can or cannot issue a tsunami warning. However, there are some warning signs of an uprising of a tsunami, and automatic systems can provide warnings immediately after an earthquake in time to save many lives. One of the most successful systems uses, bottom pressure sensors that are attached to buoys (floating device, in this case with a sensor attached.) The sensors constantly monitor the pressure of the overlying water column. This can be seen in this calculation.

\,\! P = \rho gh

In this calculation the “P” is the pressure in newtons per meter square. Were the “p” is the destiny of the sea water. And “g” is the acceleration due to gravity. Lastly the “h” is the height of the water (in meters.)

Common Places tsunamis hit:

There are lists of places that tsunamis hit/start often:

1. Most tsunamis, about 80 percent, happen within the Pacific Ocean’s “Ring of Fire,” a geologically active area where tectonic shifts make volcanoes and earthquakes common.

2. Australia

3. Japan

4. Indonesia

5. L.A (Los angles)

6. Peru

7. Papa New Guinea

8. Russia (Kuril Islands)

9. Philippines

10. Chile

How it forms:

A tsunami can be generated by any disturbance that displaces a large water mass from its “stabilized” position. In the case of earthquake-generated tsunamis, the water column is disturbed by the uplift or subsidence of the sea floor. Submarine landslides, which often accompany large earthquakes, as well as collapses of volcanic eruption, can also disturb the overlying water column as sediment and rock slump down slope and are redistributed across the sea floor. Similarly, a violent submarine volcanic eruption can create an impulsive force that uplifts the water column and generates a tsunami. Super marine landslides and cosmic-body impacts disturb the water from above, as momentum from falling debris is transferred to the water into which the debris falls. Generally speaking, tsunamis generated from these mechanisms. Large vertical movements of the earth's crust can occur at plate boundaries. Plates interact along these boundaries called faults.

Conclusion:

In conclusion I believe that these masses of destruction create a hazard for living, If we as humans would follow the instructions that are given to us, we can prevent thousands of deaths, and as we develop so dose our technology, this technology in the future just could save us from death (because of tsunamis.) There are already man areas that are jeopardized and in need of our help these are countries like Japan, Australia, Papa New Guinea and Chile. These are places we can predict earthquakes, people in these countries need help when these earthquakes hit because the hit hard, for example in Chile the earthquake had 9.5 mag. We need to be more aware of when earthquakes are going to hit, to save lives.

MLA Bibliography

1. "Occurrences of Tsunamis in the Pacific Ocean." 19 June 2009. Web. 24 Feb. 2011. .

2. Wikipedia. "Tsunami." Wikipedia, the Free Encyclopedia. 12 Mar. 2004. Web. 24 Feb. 2011. .

3. "How Are Tsunamis Formed?" Oracle. 7 Nov. 2003. Web. 24 Feb. 2011. .

4. "What Is a Tsunami?" Windows to the Universe. 15 May 2006. Web. 24 Feb. 2011. .

Tuesday, February 22, 2011

Wave Interference

When I looked at the wave simulator on this website http://phet.colorado.edu/en/simulation/wave-interference this simulator helped me understand how different types of waves "look like" when they acqure, and what they can do to the surface they are hitting. This simulator really helped me during my test because I realized how sound waves, light waves and water waves differ.


Water Wave


Light Wave


Sound Wave

Seismograph lab

Adrian, Brin and Jan

Due Feb. 21, 2011


Locked vs. Free Seismogram Paper in a Custom Seismograph


I. GUIDING QUESTION: When creating a custom seismograph, is it better to have the paper that the seismogram will be recorded onto locked into place while the ground below it moves, or is it better to have the paper loose and being dragged forward slowly?

II.HYPOTHESIS:

Adrian’s Hypothesis: I think that it is better to have the paper locked into place on a moving platform, because if the paper was lose, it might resist the moving platform’s movement because of inertia and inaccurately record the moving platform’s movement.
Brin’s hypothesis:
I believe that it is more sophisticated if the paper was to be “Locked” on the platform, because if it was not it could stop the platform from moving, this is because of inertia, if the paper is locked the results will be much more accurate.
Jan’s hypothesis: I think that if the paper remains stationary, the results should be more accurate when it comes to recording the strength of the “earthquake”. On the other hand, with the paper moving, we can do a much better job at recording how the “earthquakes” gradually strengthens or weakens.

III. EXPLORATIONS:

Materials
  1. Marker.
  2. Many blank papers.
  3. String.
  4. Around 5 one Meter Sticks.
  5. Masking tape.
  6. Rubber bands.
  7. About 15 Large metal washers that will be used as weights.
  8. Scotch tape.
  9. A large table
  10. A cabinet or piece of furniture adjacent to the large table that isn’t connected to the large table and doesn’t move easily.


Procedure
  1. Sturdily tape or rubber band together 4 one meter sticks.
  2. Stand this contraption up vertically next to your cabinet/piece of furniture, and tape the meter stick contraption tightly onto the cabinet/piece of furniture sing masking tape, in multiple locations for extra strength.
  3. On the top of the meter stick, lie down a meter stick face down, so that about 15-20 cm of the meter stick is on one side, and 80-85 cm is on the other. The short side should be on the far side of the table, and the long side should be at least 30 cm over the table. Secure the single meter stick on with lots of masking tape. Now you should have built something that looks like a crane attached to a cabinet/piece of furniture.
  4. Make two bundles of about 7 or more stacked metal washers, and tape them together using masking tape. Place them on the small side (the 15-20 cm side) of the top of the “crane”, and tape the bundles onto the surface of the meter stick so they are stable. Your “crane” now has weights that will help it remain stable and counteract the weight that will be placed on the long end of the crane.
  5. Cut a piece of string (the string’s needed length depends on how high the top of the long end of the crane is over the table, but I recommend around 75 cm to give yourself enough room if you need it), and fold it in half.
  6. Using that folded string, tape the end that is folded onto the tip of the long side of the “crane”. Trim the ends of the other side so they are both of equal length, and are a few centimeters above the surface of the table.
  7. Tape a marker top-down to the suspended strings, so that the tip of the marker is barely touching the tip of the table.
  8. On the middle of the marker, tape one metal washer (the same as you used before) to use as a weight that stabilizes the marker.
  9. Tape down two pieces of paper horizontally next to to each other under the marker, so the marker has one long paper path to travel on. This is for test where the paper is fixed into place.
  10. For the other test, tape together two pieces of paper, but do not tape them down to the table.
  11. For the non-fixed-paper test, tape together 2 sheets of paper and as the table is being shaken back and forth but not down, have someone slowly slide the paper down.
  12. For the fixed-paper test, shake the table as strong or lightly as you like, with variation for 30 seconds while slowly moving the table to the side at a consistent rate. (Note if you can’t fit 30 seconds of earthquaking on two papers, just add more papers.)


IV. RECORD & ANALYZE

Data Tables: Pictures of our seismograms:


Analysis of Data:

Adrian’s analysis: The first picture shows the seismogram we produced with the non-fixed paper method. The method failed to produced accurate and reliable results. We deemed this method a failure, as indicated by the text in the picture. The second picture showed our second method, where to paper was fixed into place. Although this method wasn’t all that reliable either, it was much more reliable than the first method and the results were inherently better. You can see we tested a “strong earthquake” by shaking the table very hard on the top (the left side) and we tested a “lighter earthquake” by shaking the table less hard on the bottom (the right side). In other words, you can see accurately when we were tested either hard or weaker earthquakes in the second picture, but you can’t really tell when there was a hard or weak earthquake in the first picture. That’s why we deemed our second method a “WIN!”. I believe that the second method was better than the first because when the paper was loose and not fixed into place, it didn’t move when the table did, and it also sometimes drifted to the side and had other off quirks that interfered with the reliability of the data. However, when the paper was taped to the table, it moved with the table, and never drifted off the the side, which led to better and more reliable data.
Brin’s analysis:
In the first picture we (me and Adrian) had a paper that was not taped or fixed onto the table, this method did not work because the paper kept moving and so did the table, so our result was not very accurate. The second picture shows the results to when me and Adrain taped the paper onto the table, this was our second method, it was not too reliable but it gave us the basic earthquake strength and it was much more reliable than our first method. This can be proved because, in the picture were it sais “FAIL”, we shuck the table with a lot of force, the data remained basically the same when we shuck the table with less force this told us that there was something wrong with our method. Then we used our second method (the paper that states “WIN”) on it. It was much more effective because as you can see when we taped the paper to the table the results for the larger force were larger then the results of the weaker force. Even of the paper was taped to the table it was still moving with the table this is what led to a “WIN” and more reliable data.
Jan’s analysis:

V. CONCEPT ACQUISITIONS (CONCLUSION):

Adrian’s Conclusion: My guiding question was: “When creating a custom seismograph, is it better to have the paper that the seismogram will be recorded onto locked into place while the ground below it moves, or is it better to have the paper loose and being dragged forward slowly?”. In our experiments, I found that it was better to have the paper locked into place while the ground below it moves. It is that way because if the paper isn’t locked into place, it doesn’t move while the ground below it moves (it doesn’t move because of inertia), and the paper sometimes drifts to the sides, both of which make the seismograms from the non-fixed-paper seismograph less reliable. That is pretty much what my hypothesis stated, so my hypothesis was correct.
Brin’s conclusion:
My guiding question was: “When creating a custom seismograph, is it better to have the paper that the seismogram will be recorded onto locked into place while the ground below it moves, or is it better to have the paper loose and being dragged forward slowly?” When I looked back at our experiments I found out that is was much more effective when the paper is stationary or locked onto the place that is moving due to the movement of the ground. This is because paper is locked in place, the paper doesn't move due to Inertia. And when we had the paper “free” it sometimes slipped away form the paper which made our data less reliable, and we also almost ruined the desks. This is what I stated in my hypothesis so i believe it was correct.
Jan’s conclusion:

VI. CONCEPT APPLICATION (FURTHER INQUIRY):

Adrian’s Further Inquiry: In this lab, my data from the custom seismographs wasn’t very reliably valid by usual scientific standards, but I found that it is incredibly difficult to make your own seismograph that reliably produces valid data. By our own custom seismograph reliability standards, our second test was acceptably reliably valid, but our first simply was not. The biggest reason that the data from the first test wasn’t reliably valid was the same thing that I was writing the whole lab about: the first test’s paper didn’t move with the paper and often drifted to the side.
Brin’s further inquiry:
In our lab our data wasn't to reliable but through working with my partners we figured out it was difficult to create a seismograph that was reliable and correct. But on the other hand our second seismograph was valid but not as much as it could be, this is because the seismograph was only a simple model. One of our shockers was our first test the data was not reliable because of the fact that the paper was “free” this made our seismograph invalid, I believe next time we would make this project we could have more reliable and valid data.

Jan’s further inquiry:

Extra stuff: Photos and video of our setup:
http://www.youtube.com/watch?v=wKnuEJMpFDc

Monday, February 7, 2011

Notes Section 2-3 & Questions

  • Zhang Heng, designed and build the earthquake detection device in China 2,000 years ago.
  • Seismic waves cause the seismographs drum to vibrate. But the suspended weight with the pen attached moves very little. Therefore, the pen attached moves very little. Therefor the pen stays in place and records the drums vibration.
  • The pattern of lines is called a seismograph.
  • To monitor faults, geologists have developed instruments to measure changes in elevation, tilting of the land surface, and ground movement along the faults.
  • Seismographs an fault-monitoring devices provide data used to map faults and detect changes also faults. Geologists are also trying to use these data to develop a method of predicting earthquakes.
  • Friction
  • Friction; is the force that opposes the motion of one surface as it moves across another surface.
Questions/Answers
1. What is a Seismograph?
A. A measuring instrument for detecting and measuring the intensity and direction and duration of movements of the ground (as an earthquake)
2. How does a Seismograph record seismic waves?
A. It is the Same when you write a sentence, the paper stays in one place while your hand moves the pen. But in a seismograph, it's the pen that remains stationary while the paper moves. Why is this? All seismographs make use of a basic principle of physics: Whether it is moving or at rest, every object resists any change to its motion. A seismograph's heavy weight resists motion during a quake. But the rest of the seismograph is anchored to the ground and vibrates when seismic waves arrive.
3. A seismograph records a strong earthquake and a week earthquake. How would the seismograph for the two earthquakes compare.
A. One of the lines recorded with be much smaller this will be the weaker earthquake.
4. What four instruments are used to monitor faults.
A. The creep meter, tilt meter, laser-ranging devices, and the satellite monitors.
5. What changes does each instrument measure
A. Tilt, then creep, and monitors.
6. A satellite that monitors a fault detects an increasing tilt in the land surface along the fault. What could this change in the land surface indicate
A. That there was an earthquake there.
7. What are three ways i which geologists use seismographs data?
A. They map faults, detect changes along faults, and develop a method of predicting earthquakes.
8. How do geologists use seismographic data to make map faults.
A. When seismic waves hit a fault, the waves are reflected off the fault.Seismograph can detect these refkected seismic waves.Geologists then use these data to map the fault's length and depth.
9. Why do geologists collect data on friction along the sides of faults.
A. So that geologist can predict how much force of pressure applied on the faults to predict how strong the earthquake.


Slovenian Earthquakes

The latest earthquake in Slovenia was on Friday the 4 of February 2011, it was 1.5 Ml which is very small.The Earthquake did not even reach my home city because it was only 6 miles from Ljubljana Earthquakes could happen a lot in Slovenia but the 10 latest earthquakes were from 1-2.5 Ml. And the 10 earthquakes were from Sept. 26 2010 to Feb. 4 2011.

Thursday, February 3, 2011

Finding the Epicenter

Finding the Epicenter

How can you locate an earthquake?

You can create circles in places were earthquakes occur, then were the circles touch each other that is the epicenter.

Materials

1. Drawing compass with pencil.

2. Outline of the United States

Procedure

1. Make Copy of the data table showing differences in earthquake arrival times.

2. The graph shows how the difference in arrival times between P waves

and S waves depends on the distance from the epicenter of the

earthquake. Find the difference in arrival time for Denver on the y-axis

of the graph. Follow this line across to the point at which it crosses the

curve. To find the distance to the epicenter, read down from this point to

the x-axis of the graph. Enter this distance in the data table.

3. Repeat Step 2 for Houston and Chicago

4. Set your compass at a radius equal to the distance from Denver to the

earthquake epicenter that you recorded in your data table.

5. Draw a circle with the radius determined in Step 4, using Denver as the

center. Draw the circle on the map. (Hints: Draw your circles carefully.

You may need to draw some parts of the circles off the map.

6. Repeat Steps 4 and 5 for Houston and Chicago

Data:

Data Table

City

Difference in P and S Wave Arrival Times

Distance to Epicenter

Denver, Colorado

2 min 40 s

1600

Houston, Texas

1 min 50 s

1000

Chicago, Illinois

1 min 10 s

600

Analyze and Conclude

1. Observe the three circles you have drawn. Where is the earthquake’s

epicenter?

A. A. Kansas

2. Which city on the map is closest to the earthquake epicenter? How far, in

kilometers, is this city from the epicenter?

A. Dodge City

3. In which of the three cities listed in the data table would seismographs

detect the earthquake first? Last?

A. Illinois, Texas, Colorado

4. About how far from San Francisco is the epicenter that you found? What

would the difference in arrival times of the P waves and S waves be for a

recording station in San Francisco?

A. About 2000 kilometers The P waves would make it to San Francisco.

5. What happens to the difference in arrival times between P waves and

S waves as the distance from the earthquake increases?

A. The P waves are much Stronger and Faster.

6. Review the procedure you followed in this lab and then answer the

following question. When you are trying to locate an epicenter, why is it

necessary to know the distance from the epicent for at least three

recording stations?

A. So that the Information is correct, it must be correct because it is vital to citizens health.